Mutable Style
Our aim here is to start from some working example. Usually an example vega chart.
We'll want to manipulate the underlaying JSON specification, to get what we want. To this we'll take a bunch of Seq[ujson.Value => Unit], and feed them to the example chart. In the example below, a vega-lite example line chart.
As always... lean into vega;
Ultimately, our aim might be to plot a line chart with our own data.
Adding a title
To start simple, let's add a title modifier.
I'm writing out the types here in the hopes of being helpful. It looks harder than it is... After you've done it twice it gets easy. REPL is your friend :-).
import viz.vega.plots.{LineChartLite, given}

val addTitle : ujson.Value => Unit =
    (spec:ujson.Value) => spec("title") = "A Timeseries"
val chart = LineChartLite(
  Seq(
      addTitle,
      viz.Utils.fixDefaultDataUrl,
      viz.Utils.fillDiv
  )
)
viz.js.showChartJs(chart,node)
But there are a couple of things which are messy about our modification; 1. We've hardcoded the title 2. the anonymous function display is very anonymous.
Let's have another go. With a little more ceremony, we have something that looks easier afterwards.
Better title modifier
import viz.vega.plots.{LineChartLite, given}

def addTitleB(in:String): ujson.Value => Unit = new((ujson.Value => Unit)) {
    override def toString = s"set title to be $in"
    def apply(spec: ujson.Value) = spec("title") = in
 }

val chart = LineChartLite(
      Seq(
          addTitleB("Much better"),
          viz.Utils.fixDefaultDataUrl,
          viz.Utils.fillDiv
      )
  )
viz.js.showChartJs(chart, node)
Here's what that would look like in JVM scala;
import viz.vega.plots.{LineChartLite, given}

def addTitleB(in:String): ujson.Value => Unit = new((ujson.Value => Unit)) {
    override def toString = s"set title to be $in"
    def apply(spec: ujson.Value) = spec("title") = in
 }

LineChartLite(
  Seq(
      addTitleB("A Timeseries"),
      viz.Utils.fixDefaultDataUrl,
      viz.Utils.fillDiv
  )
)
// res0: LineChartLite = LineChartLite(
//   mods = List(
//     set title to be A Timeseries,
//     Fix default data url,
//     viz.Utils$$$Lambda$15140/0x000000080395e840@4b97359d
//   )
// )
At this point, i think we have a hint on a simple way to inject data - the same way as we injected a title
Piping in the data
import viz.vega.plots.{LineChartLite, given}
import java.time.LocalDate
case class TimeSeries(series: Seq[(LocalDate, Double)])
val ts = TimeSeries(
Seq(
(LocalDate.of(2021,1,1), 0.2),
(LocalDate.of(2021,6,1), 20),
(LocalDate.of(2021,12,31), 5.5),
)
)
def addData(in: TimeSeries) = new (ujson.Value => Unit) {
override def toString = "pipe in data"
def apply(spec: ujson.Value) =
val data = in.series.map(p =>
ujson.Obj("date" -> p._1.toString(),"price" ->p._2)
)
spec("data") = ujson.Obj("values" -> data)
val _ = spec.obj.remove("transform")
()
}
val chart = LineChartLite(Seq( addData(ts),viz.Utils.fillDiv ))
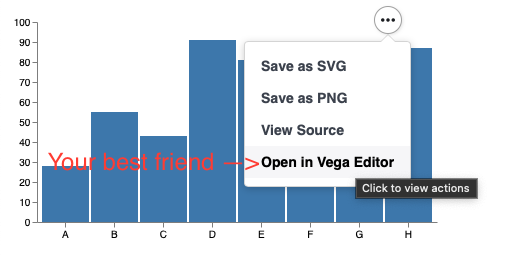
viz.js.showChartJs(chart, node)Generally, I find that the best "workflow", is to pump the data into the spec and plot it. It usually shows up blank. Open it up in the vega editor and fix it. It's then easy to backport the modification into scala.
In the first instance, this looks like quite a bit of ceremony. What's important to remember, is that you can compose the modifiers... and ultimately, end up with your own library of them!
Discussion
The big advantage of the mutuable approach, is that you get instant access to the entire vega API, which is just JSON. It therefore represents the "ultimate fallback" option.
The big disadvantage, is that it the "developer experience", isn't great. The ceremony to get the json shapes in the right place, is rather tedious, plus you don't get compile time hints if this are going to go wrong.
Reading this back the example is weirdly contrived. Mostly when I'm working with an existing datatype, it already has a JSON serialisation strategy in place. It really ought to be possible to leverage that somehow ...
Conclusion
I've found this style to be rather convenient in practise for small mofications, adding axis titles, chart titles.