Chart Sources
- Identify a plot which looks similar to your desired visualisation
- Customise it, by modifiying the JSON spec to be your desired visualisation
As always... lean into vega;
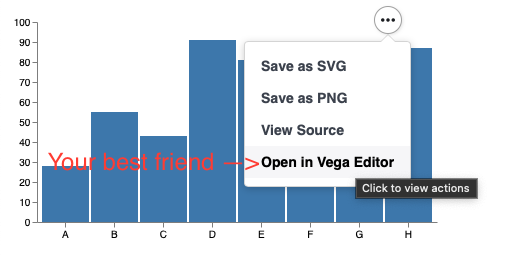
Chart sources
The core promise of the library, is that it wraps Vega. It goes at least one further step, by making the "examples" on the vega website, easy to plot, and then customise. They are in fact, sourced directly from the vega website.
Someone was apparently crazy enough to implement pacman in vega. As "proof" that we really did all the examples, and for your gaming pleasure.
import viz.vega.plots.given

viz.js.showChartJs(viz.vega.plots.Pacman(), node)
More seriously though, this library is targeted at "work".
As well as the examples, for publishing, you may not wish to reach out to the vega webiste. You may have some "deep customistaion" that you wish to preserve directly as a spec, etc etc. We can cater for this in a few ways.
Modifier Concepts
We aim to represent each "plot" is a case class which accepts a list of "modifiers". It is recommended to ensure chart accept an argument of type;
Seq[ujson.Value => Unit] i.e. a list of functions which modifiy a ujson.Value
This signature appears often enough that it is aliased as;
type JsonMod = Seq[ujson.Value => Unit]Each time a plot "case class" (e.g. BarPlot) is instantiated, each of these functions is applied to a "base spec". An examplesignature of viz.vega.plots.SimpleBarChart() is
case class BarChart(override val mods : JsonMod=List())(using PlotTarget) extends FromUrl(SpecUrl.BarChart)The constiuents of this definition are;
- mods change the spec (to make it look the way you want - for example adding your own data)
- PlotTarget is a side effect which is run when the case class is created. Often will display the plot in a browser.
- The final part tells this case class, where to obtain the spec from the library of vega excamples. In this case, https://vega.github.io/vega/examples/bar-chart.vg.json